Factor group
Sound, Infrasound & Vibration
Sound below the threshold of conscious hearing — from HVAC fans, passing lorries, and wind turbines — can produce measurable anxiety, raised stress hormones, and fleeting movement at the edge of vision. Knowing where it comes from is part of a clean investigation.

What it is
Infrasound
Infrasound is acoustic energy below roughly 20 Hz — beneath the normal range of conscious human hearing. It is produced continuously by natural phenomena (wind, ocean waves, storms, volcanic activity) and by ordinary man-made sources: heavy road traffic, railways, aircraft, large industrial machinery, HVAC systems, and wind turbines. Because you cannot hear it, its effects on the body arrive unexpectedly and are easily attributed to the wrong cause.
Low-frequency audible noise (LFN)
Low-frequency audible noise (LFN) sits in the 20–200 Hz band — the boundary between infrasound and normal speech frequencies. Large roads, rail lines, airports, and industrial plant generate significant LFN that passes through building fabric with little attenuation. Its droning, persistent character makes it stressful and disruptive even at modest sound pressure levels.
Structural vibration and resonance
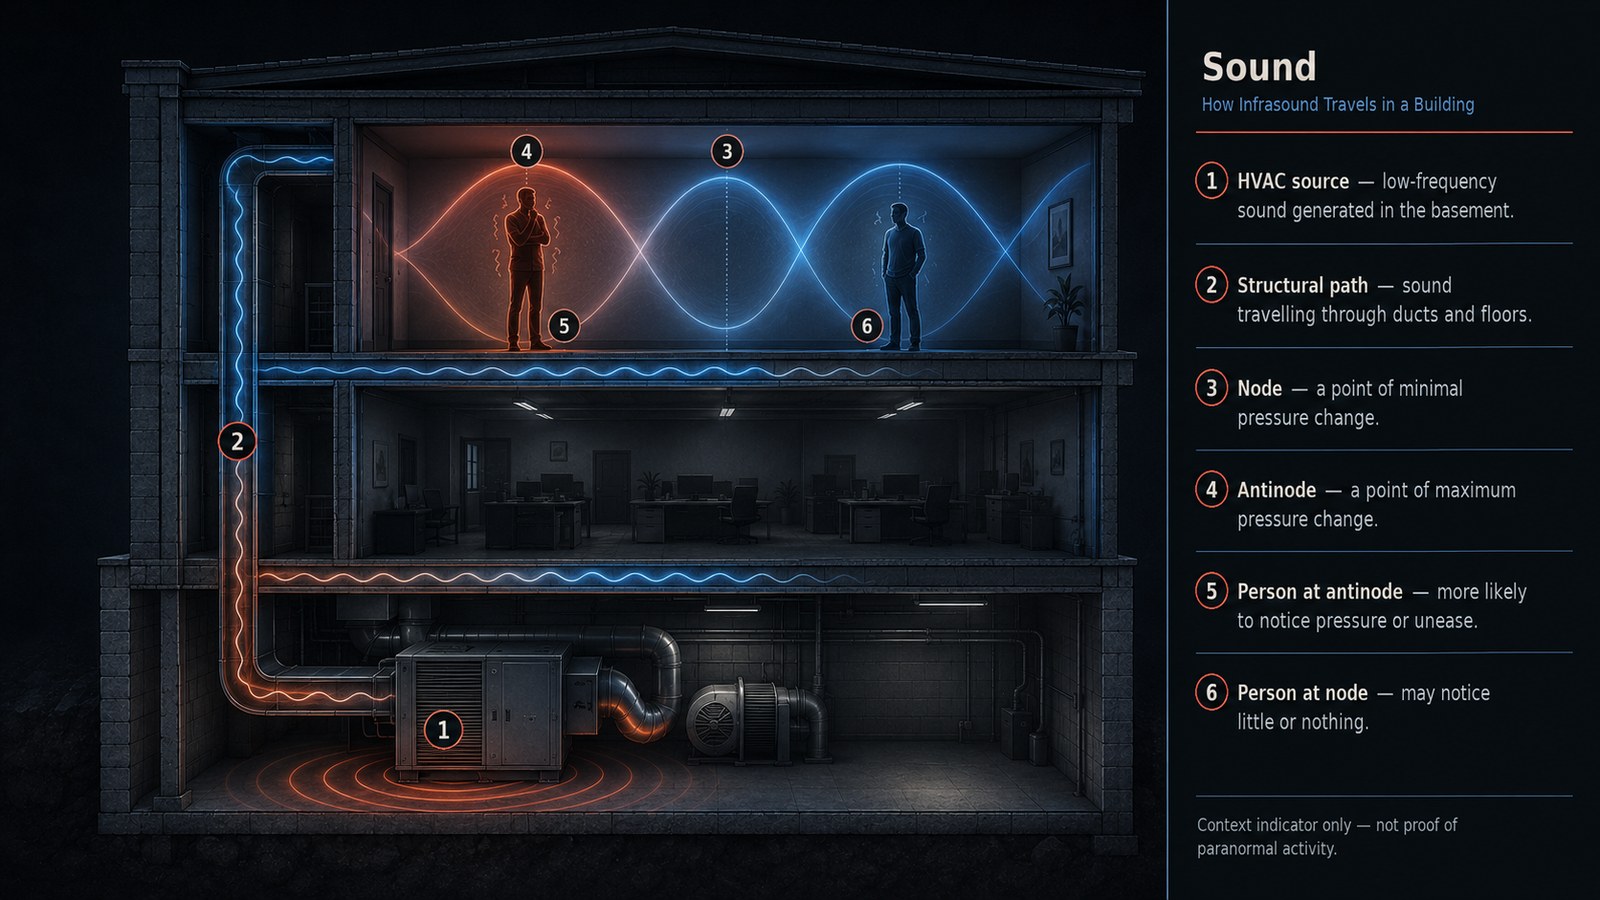
Structural vibration and resonance occur when a building, floor, or room is driven at or near its natural resonant frequency. Rooms have predictable modal resonances — typically 20–200 Hz — set by their physical dimensions. When a source feeds energy in at a modal frequency, standing waves form, creating zones of amplified pressure (antinodes) and near-silence (nodes). An investigator standing at an antinode may feel pressure, vibration, or unease that is absent a metre away.
Vibration transmission
Vibration transmission through solid structure — foundations, pipework, ducts, and partitions — carries mechanical energy from a distant source (a basement boiler, a road, a rail cutting) into parts of a building far from the origin. That makes pinning down the source difficult without systematic measurement.
Subcategories
Infrasound and human physiological effects
Infrasound below 20 Hz can induce unease, anxiety, dread, and mild disorientation without the subject being consciously aware of any sound source. Detection appears to occur through bone conduction, inner-ear structures, and resonance within body cavities rather than normal hearing. A 2026 peer-reviewed study (Schmaltz et al., Frontiers in Behavioral Neuroscience) found that even five minutes of exposure at around 18 Hz raised salivary cortisol and increased self-reported irritability and sadness in participants who could not consciously detect the signal. The effects sat below conscious awareness — percipients attributed the feelings to their surroundings, not to a sound.
The 18–19 Hz eyeball-resonance hypothesis
A widely cited hypothesis, originating with Vic Tandy's work and references to NASA biomechanics research, proposes that infrasound near 18–19 Hz may approach the resonant frequency of the human eyeball. The suggested mechanism is that vibration of the vitreous humour smears peripheral vision, producing shadowy or indistinct shapes at the edge of the visual field. This claim is weakly evidenced (see Uncertainties): the frequency of eyeball resonance is not firmly established, the mechanism predicts whole-field rather than peripheral-only disturbance, and the visual effects Tandy described have not been replicated under controlled conditions. Treat it as a plausible but unconfirmed hypothesis, not an established mechanism.
Natural infrasound sources
Naturally occurring infrasound spans a wide frequency range: large tornadoes produce energy around 0.2–1 Hz; microbaroms from ocean-wave interactions occur near 0.2 Hz; wind over terrain generates broadband infrasound up to around 5 Hz; volcanic eruptions and severe thunderstorms also produce infrasonic signatures. These background signals are everywhere but generally too low in frequency and amplitude to produce the physiological effects attributed to the 18–19 Hz range. They are detectable by sensitive equipment and provide a baseline "floor" against which man-made sources must be judged.
Man-made infrasound sources: HVAC, fans, and machinery
HVAC fans, large ventilation ducts, industrial compressors, and transformer rooms are among the most common sources of infrasound in buildings. A 2023 case study (Environmental Research and Public Health, via PMC) found that in one administrative building, turning off the ventilation system caused a very large drop in noise level across the entire 0.05–10 Hz range, confirming it as the dominant continuous source. HVAC noise concentrates heavily below 250 Hz; the standard A-weighted measurements used in most regulatory contexts substantially underestimate its impact, because A-weighting attenuates low frequencies.
Wind turbines
Wind turbines produce infrasound and LFN as a by-product of blade rotation and mechanical drive components. Multiple national health reviews — including a 2014 Frontiers in Public Health review and a 2017 Acoustics Australia article — concluded that measured infrasound levels from operational turbines at typical setback distances fall well below established perception thresholds. Self-reported symptoms in some residents near turbines are real, but controlled studies consistently point to a nocebo mechanism (the expectation of harm producing symptoms) rather than a direct acoustic effect. This remains an area of active scientific and regulatory debate.
Road, rail, and airport LFN
UK Department for Environment, Food & Rural Affairs (Defra) strategic noise mapping (most recent round: 2022) estimates that around 40% of adults in England are exposed to long-term road traffic noise above 50 dB — the level at which health effects become detectable. In 2018 alone, around 100,000 disability-adjusted life years were attributed to road noise in the UK, 13,000 to rail, and 17,000 to aircraft. These figures cover all noise frequencies; the low-frequency component penetrates building fabric most effectively and is the hardest to attenuate. The UK Civil Aviation Authority and Defra publish receptor-level exposure data under the Open Government Licence.
Structural resonance and standing waves
Physical room dimensions determine where modal resonances fall. Most rooms have fundamental resonances in the 20–200 Hz range, each tied to the room's length, width, or height. When a source drives energy at a modal frequency, standing waves produce large spatial variation in sound pressure level — sometimes 20 dB or more across a few metres. These pressure variations are felt as well as heard, producing sensations of pressure, heaviness, or vibration that depend strongly on exactly where a person is standing. An investigator who moves two paces may notice a complete change in perceived atmosphere that tracks the acoustic node/antinode pattern rather than any feature of the room.
Tunnels, ducts, and pipework
Underground tunnels, building service ducts, drainage channels, and heating pipework act as waveguides, carrying low-frequency sound with very low attenuation over long distances. A sound generated in a basement plant room can arrive at an upper-floor corridor intact in frequency and only modestly reduced in level. Cellar spaces, Victorian tunnels, and industrial underfloor voids are particularly effective waveguides — directly relevant to Vic Tandy's investigations (see Examples).
Examples & documented cases
Tandy & Lawrence (1998): "The Ghost in the Machine"
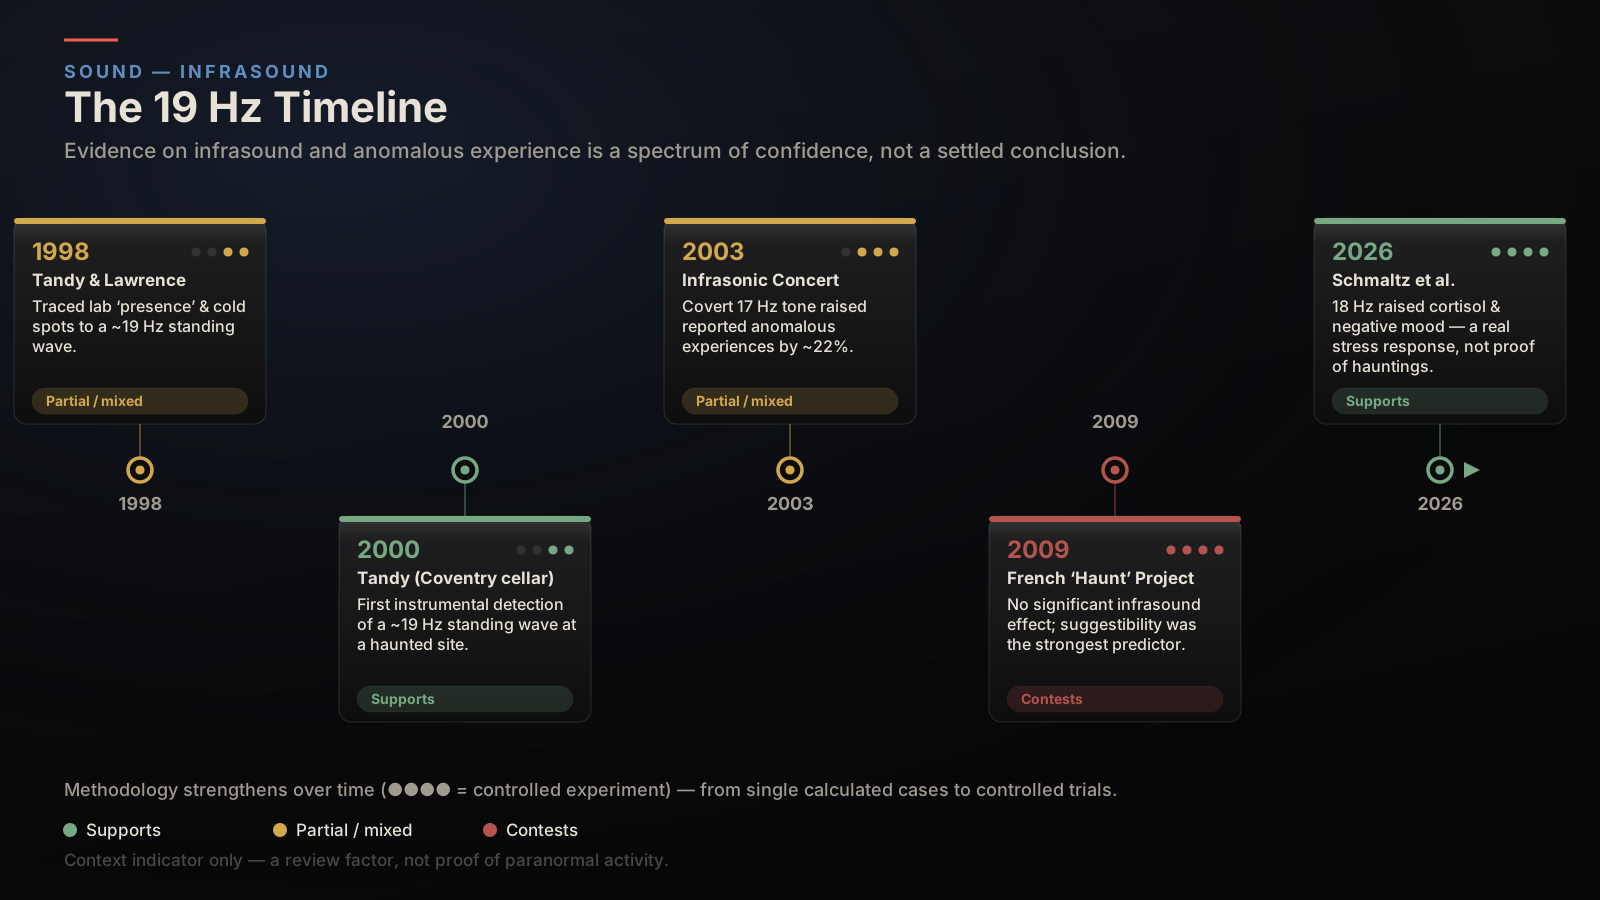
Vic Tandy, a lecturer at Coventry University, and Dr Tony R. Lawrence published their foundational paper in the Journal of the Society for Psychical Research (vol. 62, pp. 360–64, 1998). Tandy had been working in a research laboratory where staff experienced feelings of depression, cold, and a sense of presence; Tandy himself reported seeing a grey figure at the edge of his peripheral vision that vanished when he turned to face it. The next day he noticed his fencing foil vibrating in its vice when clamped in the lab. Investigation traced the cause to a recently installed extractor fan producing a standing wave estimated mathematically (not directly measured) at approximately 18.98 Hz. The fan was switched off and the phenomena stopped. Tandy and Lawrence proposed that infrasound near 19 Hz might, under certain conditions, generate sensory phenomena consistent with a haunting. Methodological note: the frequency was calculated, not directly measured, and no instrumental record of the reported visual effect was made (see Uncertainties). [1]
Tandy (2000): "Something in the Cellar" (Coventry)
Tandy went on to investigate the medieval cellar beneath Coventry's Tourist Information Centre, where some visitors had reported feelings of a "presence." Using acoustic measuring equipment, he found a near-19 Hz standing wave in the connecting corridor between the modern building and the 14th-century cellar — consistent with his earlier laboratory findings. This was the first time a 19 Hz standing wave was instrumentally detected (rather than calculated) in a reportedly haunted location. [2]
Wiseman, Lord & Watt / Infrasonic Concert (2003)
Psychologist Richard Wiseman and colleagues Sarah Angliss and Ciarán O'Keeffe organised two public concerts at the Purcell Room, London (31 May 2003), under the title Soundless Music. Around 700 attendees heard four musical pieces, two of which were secretly laced with a 17 Hz infrasonic tone at near-threshold amplitude. Participants were surveyed immediately afterwards. Those exposed to the pieces carrying the 17 Hz tone reported a statistically significant 22% increase in anomalous experiences, including chills, unease, inexplicable sadness, and a sense of presence. Wiseman concluded that "low-frequency sound can cause people to have unusual experiences even though they cannot consciously detect infrasound." Note: the effect size was modest, and the experiment has not been formally replicated under peer-reviewed conditions. [6]
French et al. (2009): "The Haunt Project"
Researchers at Goldsmiths College, University of London (Christopher French, Usman Haque, Rosie Bunton-Stasyshyn, Rob Davis) built a purpose-made chamber and exposed 79 participants to infrasound (18.9 Hz and 22.3 Hz), complex electromagnetic fields (EMF), both, or neither, in a 2×2 factorial design over 50-minute sessions. Some 79.7% of participants reported unusual sensations of some kind — but there were no statistically significant differences between the infrasound and non-infrasound conditions. The strongest predictor of a reported anomalous experience was individual suggestibility, not acoustic or electromagnetic condition. French concluded that simply telling participants they might experience something unusual was more predictive than the physical conditions applied. [4]
Schmaltz et al. (2026): Infrasound, Cortisol, and Aversive Responding
Published 27 April 2026 in Frontiers in Behavioral Neuroscience, this controlled experiment exposed 36 participants to either horror-themed or calming music, with 18 Hz infrasound (~75–78 dB) either present or absent. Participants could not accurately tell when infrasound was present. Even so, infrasound exposure significantly raised salivary cortisol and increased self-reported irritability, sadness, and disinterest, independently of music type. The authors proposed an evolutionary arousal-vigilance mechanism: infrasound — common near traffic, industrial machinery, and ageing HVAC systems — engages subconscious threat-detection pathways without triggering conscious hearing. This is the most methodologically rigorous recent study to find a positive physiological effect at environmental-level intensities. [3]
How it affects an investigation
What equipment detects it
Infrasound (< 20 Hz): infrasound-capable condenser microphone (e.g. GRAS 46AZ or PCB 378A07) with spectrum analyser or FFT software — standard consumer mics typically roll off below 20 Hz; specialist mics are required. Low-frequency noise (20–200 Hz): Class 1 or Class 2 sound level meter with C-weighting and Z-weighting, plus a 1/3-octave spectrum analyser — A-weighting under-counts low frequencies; always compare A and C/Z readings. Structural vibration: accelerometer (piezoelectric or MEMS type) or geophone mounted directly to the surface — useful for floors, walls, and pipework. General SPL survey: calibrated digital sound level meter with logging (e.g. Svantek SV971A) — continuous logging over 30+ minutes to capture intermittent sources. Room mode mapping: sound level meter plus a known low-frequency source; move through the space in a grid to identify standing-wave nodes and antinodes.
False perceptions it can cause
Sense of presence or being watched — raised cortisol triggering hyper-vigilance. Peripheral visual disturbances / fleeting shapes — the proposed eyeball-resonance effect at 18–19 Hz (mechanism contested; see Uncertainties). Feelings of dread, unease, anxiety, or depression — subconscious stress response to inaudible sound. Nausea, dizziness, or pressure in the ears/chest — resonance in body cavities, inner-ear stimulation. Unexplained fatigue or difficulty concentrating — chronic low-level LFN exposure, especially from HVAC. Objects appearing to move or shimmer — structural vibration causing micro-tremors in surfaces and suspended objects.
What an investigator must check and control for
1. HVAC state: record whether heating, air conditioning, or mechanical ventilation is running. Switch it off temporarily and note whether perceived effects change. Log before/after SPL readings. 2. Nearby infrastructure: identify within 500 m — major roads (A-roads, motorways), rail lines, airports, industrial plant, data centres, substations. Check whether effects correlate with traffic peaks or train timetables. 3. Building plant: boilers, generators, pumps, and lifts in the same structure. Request plant-room access. Establish on/off cycling times. 4. Room dimensions: measure length, width, ceiling height. Calculate approximate modal frequencies (f = c/2L, where c ≈ 343 m/s and L = room dimension) to see whether a suspected infrasound source could be driving a room mode. 5. Wind conditions: high-wind events produce broadband building vibration and can induce infrasound via chimneys, vents, and gaps in fabric. Log weather data alongside acoustic measurements. 6. Measurement timing: take baseline readings over 30+ minutes before any investigation activity starts, to capture the ambient acoustic environment without human movement noise. 7. Weighting settings: always record with Z-weighting (flat to 1 Hz) or G-weighting (ISO 7196, infrasound-specific) in addition to A-weighted readings. A-weighted figures alone are not fit for purpose in LFN/infrasound assessment.
Contamination warnings
Recommended equipment
Infographics
On the map
View major-road, railway & airport noise context on the map
Defra strategic noise maps (2022 round) — Lden and Lnight contours for major roads and railways across England; GIS shapefiles published on data.gov.uk under Open Government Licence v3.0. Aviation noise contours from UK Civil Aviation Authority and airport operators also available under OGL (Heathrow, Gatwick, Stansted, Manchester, Edinburgh, and others). Together these layers let the map flag any case location within 500 m of a Defra noise "Important Area" or within 200 m of a motorway or primary rail line, surfacing an "Acoustic environment review recommended" prompt.
Shown as context only — not evidence of paranormal activity.
Show wind turbines within 1 km
BEIS Renewable Energy Planning Database (REPD) — geocoded onshore and offshore turbine locations; quarterly extract on data.gov.uk; Open Government Licence v3.0. Location accuracy ±1 km.
Shown as context only — not evidence of paranormal activity.
Flag nearby industrial land use
Ordnance Survey Open Zoomstack and ONS land-use data — highlights large industrial zones that may host infrasound-producing plant. Open Government Licence.
Shown as context only — not evidence of paranormal activity.
Connected across PRN
What the evidence does not settle
The 19 Hz eyeball-resonance claim is over-stated. Tandy's 1998 lab account involved a mathematically estimated frequency, not a directly measured one. The NASA research on human eye resonance that Tandy and Lawrence cited came from high-intensity military contexts, not environmental levels. A later critical review by Parsons (2012, Journal of the Society for Psychical Research 76, 150–74) noted that "Tandy and Lawrence calculated the frequency of the infrasound mathematically but carried out no measurements to verify it." The visual-disturbance mechanism — eyeball vibration producing peripheral phantom shapes — is plausible but undemonstrated in controlled experiments. It should be described as a hypothesis, not a finding.
The dose-response relationship is poorly defined. Existing studies expose participants to widely varying intensities (some near-threshold, some well above). Susceptibility appears to be modulated by individual sensitivity, exposure duration, and sound pressure level, but there is no established threshold below which effects cannot occur, nor one above which they reliably do. Parsons (2012) noted that "susceptibility to psycho-physiological effects of infrasound exposure seems to be linked to both exposure duration and overall sound pressure level," but the precise relationship remains unquantified.
Conflicting controlled-experiment results. The Haunt Project (French et al., 2009) produced a null result under controlled conditions, while Wiseman's concert experiment and the 2026 Schmaltz study found positive effects. The disparity may reflect methodological differences (chamber design, exposure duration, frequency selection), or it may show that context and expectation — suggestibility — mediate whether infrasound produces anomalous experiences. The literature has not resolved this.
Wind turbine infrasound remains socially and politically contested. Multiple national and international reviews have found no evidence of harm at typical setback distances. The nocebo effect is well-evidenced in this context: community annoyance and psychological distress are real, even where they have no direct acoustic cause. PRN should present both the scientific consensus and the ongoing community/regulatory debate fairly.
"The Hum" phenomena remain unexplained. The Bristol Hum, Taos Hum, and similar phenomena are widely reported, but no single source has been confirmed for any of them. Candidate sources include very-low-frequency radio transmissions, industrial noise carried over long distances, and natural geological activity. Infrasound is one candidate; none has been proven. This remains an area of informal investigation rather than settled science.
Sources
- [1] Tandy and Lawrence traced feelings of depression, cold, a sense of presence, and peripheral visual disturbances in a Coventry research lab to a standing wave estimated at ~18.98 Hz produced by an extractor fan. Frequency was calculated mathematically, not directly measured. Society for Psychical Research / Coventry University, 1998 · All rights reserved — cite facts and full reference only
- [2] Tandy instrumentally detected a near-19 Hz standing wave in the connecting corridor between the modern Tourist Information Centre and a 14th-century cellar in Coventry, where visitors had reported feelings of a presence. First instrumental (not calculated) detection of a 19 Hz standing wave in a reportedly haunted location. Society for Psychical Research, 2000 · All rights reserved — cite facts and full reference only
- [3] Controlled experiment (n=36) found that 18 Hz infrasound at ~75–78 dB significantly raised salivary cortisol and increased self-reported irritability, sadness, and disinterest independently of music type, even though participants could not detect the infrasound. Authors proposed an evolutionary arousal-vigilance mechanism. Frontiers Media SA, Published 27 April 2026 · CC-BY 4.0 open access
- [4] A purpose-built chamber experiment (n=79) with a 2×2 factorial design (infrasound at 18.9 Hz / 22.3 Hz × complex EMF) found no statistically significant differences between infrasound and non-infrasound conditions. The strongest predictor of anomalous experience was individual suggestibility. Elsevier / Goldsmiths College, 2009 · All rights reserved — cite findings and reference
- [5] Authoritative critical review of the infrasound evidence base. Notes that Tandy and Lawrence calculated the frequency mathematically but carried out no measurements to verify it. Confirms that susceptibility to psycho-physiological effects appears linked to exposure duration and sound pressure level, but the precise relationship remains unquantified. Society for Psychical Research, 2015, last updated April 2026 · All rights reserved — cite facts only
- [6] The Infrasonic Concert (Purcell Room, London, 31 May 2003, ~700 attendees) found a statistically significant 22% increase in self-reported anomalous experiences (chills, unease, inexplicable sadness, sense of presence) when a 17 Hz tone was covertly added to musical pieces. Effect size was modest; not replicated under peer-reviewed conditions. Richard Wiseman / University of Hertfordshire · All rights reserved — cite findings only
- [7] Infrasonic project summary by Sarah Angliss, co-organiser of the Soundless Music infrasonic concert experiment at the Purcell Room, 2003. Sarah Angliss · All rights reserved — cite facts only
- [8] Defra 2022 strategic noise mapping estimates ~40% of adults in England exposed to road traffic noise above 50 dB; in 2018, ~100,000 DALYs attributed to road noise, 13,000 to rail, and 17,000 to aircraft in the UK. HM Government / Defra, 2022 · Open Government Licence v3.0 (OGL)
- [9] UK Civil Aviation Authority overview of aviation noise and health, including receptor-level exposure data. Civil Aviation Authority · Crown copyright / OGL — cite with attribution
- [10] Evidence for environmental noise effects on health in the UK policy context, including DALY estimates for road, rail, and aircraft noise. MDPI / open access, 2020 · CC-BY 4.0
- [11] Expert panel review of wind turbine sound and health effects concluding that measured infrasound at typical setback distances falls below established perception thresholds. American Wind Energy Association (AWEA/CanWEA), 2009 · All rights reserved — cite facts only
- [12] Critical review of low-frequency and infrasound myths and misbeliefs; important corrective to overclaiming in the area. SAGE Publications, 2017 · All rights reserved — cite findings and reference
- [13] Room modes — physical explanation of how room dimensions determine modal resonant frequencies and how standing waves form, producing spatial variation of up to 20 dB across a few metres. Wikimedia Foundation · CC-BY-SA 4.0 — check primary sources before citing in public-facing copy
- [14] Overview of infrasound as sound waves that travel through almost any medium with very low attenuation, covering natural and man-made sources and detection methods. CNRS (French national research centre) · All rights reserved — cite facts only
Further reading
- Tandy, V., & Lawrence, T.R. (1998). The ghost in the machine. Journal of the Society for Psychical Research 62, 360–64. — Society for Psychical Research / Coventry University
- Parsons, S. (2015, updated 2026). Infrasound. Psi Encyclopedia, Society for Psychical Research. Authoritative critical review of the evidence base. — Society for Psychical Research
- Schmaltz, R. et al. (2026). Infrasound exposure is linked to aversive responding, negative appraisal, and elevated salivary cortisol in humans. Frontiers in Behavioral Neuroscience. Open access. — Frontiers Media SA
- French, C. et al. (2009). The "Haunt" project. Cortex 45(5), 619–29. — Elsevier / Goldsmiths College
- Defra (2022). Explaining the 2022 noise maps. UK Government transparency data. Open Government Licence. — HM Government / Defra
- Mühlhans, J.H. (2017). Low frequency and infrasound: A critical review of the myths, misbeliefs and their relevance to music perception research. Musicae Scientiae. — SAGE Publications